Diagrams courtesy of Dave, et al. (2021)
In the United States, the COVID-19 vaccination rate slowed from a peak of 3.6 million vaccinations per day during the week of April 5, 2021, to fewer than 2 million vaccinations per day by the week of May 3, 2021. To boost vaccine uptake, 19 states announced large cash lotteries by July 1, 2021, that were tied to COVID-19 vaccination.
For instance, on May 12, 2021, Ohio announced Vax-a-Million, a set of weekly $1 million drawings to be held over 5 weeks for Ohio residents 18 years or older who had received at least 1 COVID-19 vaccine dose. One recent study failed to find an association between the Ohio drawings and increased vaccinations. In this case-control study, Dave., et al. (2021) assessed if announcements of cash drawings in 19 states were associated with increased vaccine uptake by comparing vaccination trends in states that announced drawings with states that did not using a difference-in-differences framework.
The researchers used daily state-level COVID-19 vaccination data from the Johns Hopkins University Vaccine Tracker between April 28 and July 1, 2021, a period during which vaccine appointments were widely and rapidly available. These data were combined with announcement dates from public news reports. They also collected COVID-19 case counts from The New York Times and restaurant and bar foot traffic from SafeGraph Inc.
They used a difference-in-differences framework for analysis, which compared daily reported COVID-19 vaccinations administered per 1000 population before and after the announcement in the 19 states that announced a lottery with those in states that never announced, while controlling for covariates. They also estimated event-study models, which interacted the difference-in-differences estimator with binary indicators for the number of days prior to or after the announcement. These estimates allowed the researchers to assess how the association between announcements and vaccinations changed over time.
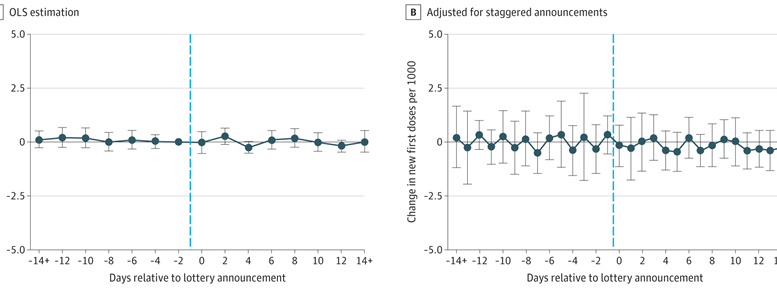
There were 37.2 million first doses of COVID-19 vaccine administered in the United States between April 28 and July 1, 2021, including 19.2 million in states that announced cash drawings. Ordinary least squares estimates of the difference-in-differences model are summarized in the Table. Estimates of the association between an announcement and vaccination rates were very small in magnitude and statistically indistinguishable from zero. For example, for first doses, the adjusted regression estimate was −0.06 (95% CI, −0.43 to 0.30) daily vaccinations per 1000 population.
This finding was reinforced by the event-time estimates plotted in the Figure.3 No statistically significant association was detected between a cash-drawing announcement and the number of vaccinations before or after the announcement date, a period that included announcements of lottery winners for most lottery states. This finding was evident using a conventional event-time model and a novel technique that better accounts for staggered announcements.
Reference: Dave D, Association Between Statewide COVID-19 Lottery Announcements and Vaccinations. JAMA Health Forum. 2021;2(10):e213117. doi:10.1001/jamahealthforum.2021.3117