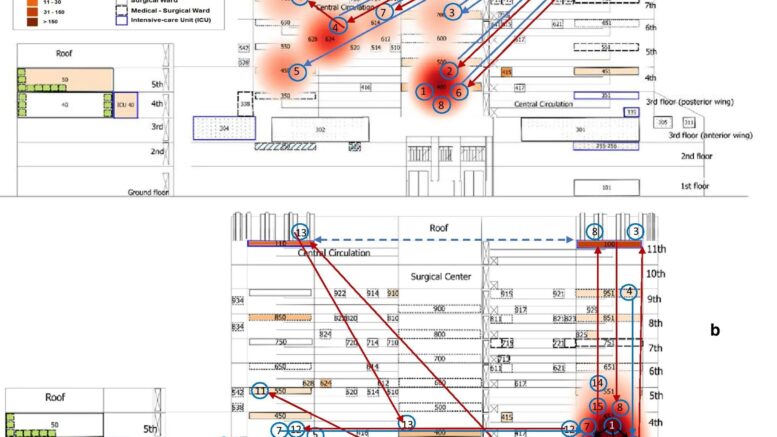
Patient flow maps during the first (a) and the second (b) clusters showing the transfers of clustered patients (arrows) between wards. The cluster is represented in red heat map layer with the occurrences of patients harboring CRKp complex during the 2nd semester 2014 (first cluster) and the 4th quarter 2015 to 1st semester 2016 (second cluster). Patient numbers are in blue circles ordered by the date of the first detection, including the first detected case in the pre-cluster period of the first cluster (patient#1). The blue and red arrows represent the transfer of a clustered patient, respectively, before and after the first detection of CRKp complex isolate. The black arrow represents the opportunity for bacteria transmission between patients, considering the admission ward or unit and hospitalization period after the first detection. While dashed blue arrow in (b) has the meaning to demonstrate that these units work together as the same ICU. Patients #1 and #8 in the first cluster and patients #2, #14 and #15 in the second group never moved to another ward and, among them, only patient #8 had the direct opportunity to acquire the bacteria from another clustered patient (patient #2) hospitalized in the same period at the same ward (#400). Courtesy of da Silva, et al. (2021)
The emergence and spread of antimicrobial resistance and infectious agents have challenged hospitals in recent decades. The aim of this study by da Silva, et al. (2021) was to investigate the circulation of target infectious agents using Geographic Information System (GIS) and spatial–temporal statistics to improve surveillance and control of healthcare-associated infection and of antimicrobial resistance (AMR), using Klebsiella pneumoniae complex as a model.
A retrospective study was carried out in a 450-bed federal, tertiary hospital, located in Rio de Janeiro. All isolates of K. pneumoniae complex from clinical and surveillance cultures of hospitalized patients between 2014 and 2016, identified by the use of Vitek-2 system (BioMérieux), were extracted from the hospital's microbiology laboratory database. A basic scaled map of the hospital’s physical structure was created in AutoCAD and converted to QGis software (version 2.18). Thereafter, bacteria according to resistance profiles and patients with carbapenem-resistant K. pneumoniae (CRKp) complex were georeferenced by intensive and non-intensive care wards. Space–time permutation probability scan tests were used for cluster signals detection.
Of the total 759 studied isolates, a significant increase in the resistance profile of K. pneumoniae complex was detected during the studied years. The researchers also identified two space–time clusters affecting adult and pediatric patients harboring CRKp complex on different floors, unnoticed by regular antimicrobial resistance surveillance.
The researchers conclude that GIS with space–time statistical analysis can be applied in hospitals. This spatial methodology has the potential to expand and facilitate early detection of hospital outbreaks and may become a new tool in combating AMR or hospital-acquired infection.
Reference: da Silva PP, et al. Geographical information system and spatial–temporal statistics for monitoring infectious agents in hospital: a model using Klebsiella pneumoniae complex. Antimicrobial Resistance & Infection Control. Vol. 10, article number 92. 2021.